Skip to content

Case study, modelled

Nine megawatts into eight

The requirement does not fit the site we have.

Modelled

A 64-rack, 4,608-accelerator requirement fits an 8 MW site that holds 57 racks today, with 3 to 8 racks to spare, modelled.

A 9 MW requirement of 64 NVIDIA GB300 NVL72 racks meets an 8 MW envelope that holds 57 racks today. With the runtime the same envelope holds 67 to 72 racks, 3 to 8 beyond the requirement, modelled. The runtime is software with no capital cost; what it removes is the power constraint.

Who it is for

A neocloud or GPU cloud operator that owns or contracts its accelerators and controls the workload. The operator signs; the change-control and security reviewer decides whether it goes ahead.

GPU cloud and neocloud

The basis

What this page is

This is modelled. Every figure below is arithmetic over inputs you can change. One number is ours, and it is measured. It is up to 21% less GPU die power on NVIDIA H100 NVL across a continuous 48-hour run. Managed and baseline arms ran under an equal cap, read as NVML die power. Die power is a lower bound on wall power. Hardware other than H100 NVL, this rack included, stays modelled until a baseline run on it. A three-week validation on your own fleet makes the figure yours.

Key figures

Every figure, what kind of figure it is, and its basis.

One figure is measured. The derived figures come from the same run. Everything else is modelled on the inputs below.

  • GPU die power

    measured

    Up to 21% less

    NVIDIA H100 NVL, continuous 48-hour run, managed and baseline arms under an equal cap, NVML die power. A lower bound on wall power.

  • Tokens per watt

    derived

    Up to +22%

    From die power and vLLM serving throughput on the same run, Balanced mode. The same tokens for less energy.

  • Throughput change in the run

    derived

    0%

    Same 48-hour run, Balanced mode, throughput and latency held.

  • Reduction the requirement needs

    modelled

    About 11% at the rack input

    One minus 8 MW over the draw of 64 racks. No coefficient of ours in it.

  • Reduction at the rack, conservative

    modelled

    About 15%

    21% applied to the 72% accelerator share, cascade factor one.

  • Reduction at the rack, stated basis

    modelled

    21%

    The die figure read as a floor on wall watts, a physics argument.

  • Racks the 8 MW envelope holds

    modelled

    57 today; 67 to 72 with the runtime

    8,000 kW over 140 kW, then over about 119 kW and about 111 kW, floored to whole racks.

  • Beyond the requirement

    modelled

    3 to 8 racks, 216 to 576 accelerators

    67 and 72 racks less the 64 required, at 72 accelerators a rack.

  • Headroom after the fit

    modelled

    About 395 kW to about 922 kW

    8 MW less the managed draw of 64 racks on each reading.

  • Margin over the reduction needed

    modelled

    About 4 to 10 percentage points

    About 15% and 21% against about 11%. The conservative margin is about fifteen times the measurement uncertainty.

  • Returned per rack

    modelled

    About 21 kW to about 29 kW

    140 kW at each reading.

  • Site rack count

    modelled

    Up about 18% to 26%

    67 and 72 racks against 57.

  • Gross revenue on the spare accelerators

    modelled

    About GBP 4,800,000 to GBP 13,000,000 a year

    216 to 576 accelerators at the illustrative GBP 3 an accelerator-hour and 85% utilisation, over 8,760 hours.

  • Hardware to fill the spare racks, the operator's purchase

    modelled

    About GBP 7,800,000 to GBP 20,800,000

    3 to 8 racks at about GBP 2,600,000 delivered, needed only to let the spare capacity. The runtime itself is software with no capital cost.

  • Energy avoided

    modelled

    About GBP 1,600,000 to GBP 2,200,000 a year

    64 racks at 95 kW mean draw, about 8,100 to 11,200 MWh a year at 20 pence. The same watts as the headroom, so not additive.

  • Reserve a fail-open event needs

    modelled

    About 960 kW

    The unmanaged draw of 64 racks against 8 MW. Headroom held back covers about 41%; a curtailment right, an interlock or a lower commitment covers the rest.

  • At ten times the scale

    modelled

    31 to 81 racks beyond a 642-rack requirement

    90 MW into 80 MW. Whole-rack rounding shifts the margin slightly.

Declared inputs

What the arithmetic runs on.

Each input is stated with its basis. Change any of them and the figures above move with it.

  • Rack type

    NVIDIA GB300 NVL72

    NVIDIA published configuration; reader-selected.

  • Accelerators per rack

    72

    NVIDIA published configuration.

  • Host processors per rack

    36

    NVIDIA published configuration. The runtime does not address their share of rack draw.

  • Rack draw at the rack input, nominal

    140 kW

    OEM system specifications, the middle of a published 132 to 142 kW range. Yours to replace.

  • Requirement

    9 MW

    Reader-supplied.

  • Envelope

    8 MW

    Reader-supplied.

  • Plane of the envelope

    IT load at the rack input

    Reader-selected. The largest driver in the model, worked under facility power below.

  • Accelerator share of rack draw

    72%, about 101 kW of 140 kW

    Arithmetic from the OEM figures. Reader-supplied, and the largest lever you hold.

  • Upstream cascade factor

    1, no credit

    Default. You can change it.

  • Coefficient at the die

    21%

    Measured on NVIDIA H100 NVL. Fixed, and not an input.

  • Operating mode

    Balanced

    The default preset, and the mode the coefficient was measured in.

  • Mean draw per rack, energy line only

    95 kW, illustrative

    Your own measured mean draw replaces it.

  • Electricity cost, energy line only

    20 pence a kilowatt-hour, illustrative

    Your contracted figure replaces it.

  • Revenue per accelerator-hour and utilisation

    GBP 3 and 85%, illustrative

    Both are your own figures; neither is a default.

  • Delivered cost per rack

    About GBP 2,600,000, illustrative

    Hardware capital the operator buys. Your own figure replaces it.

The working

The requirement and the site

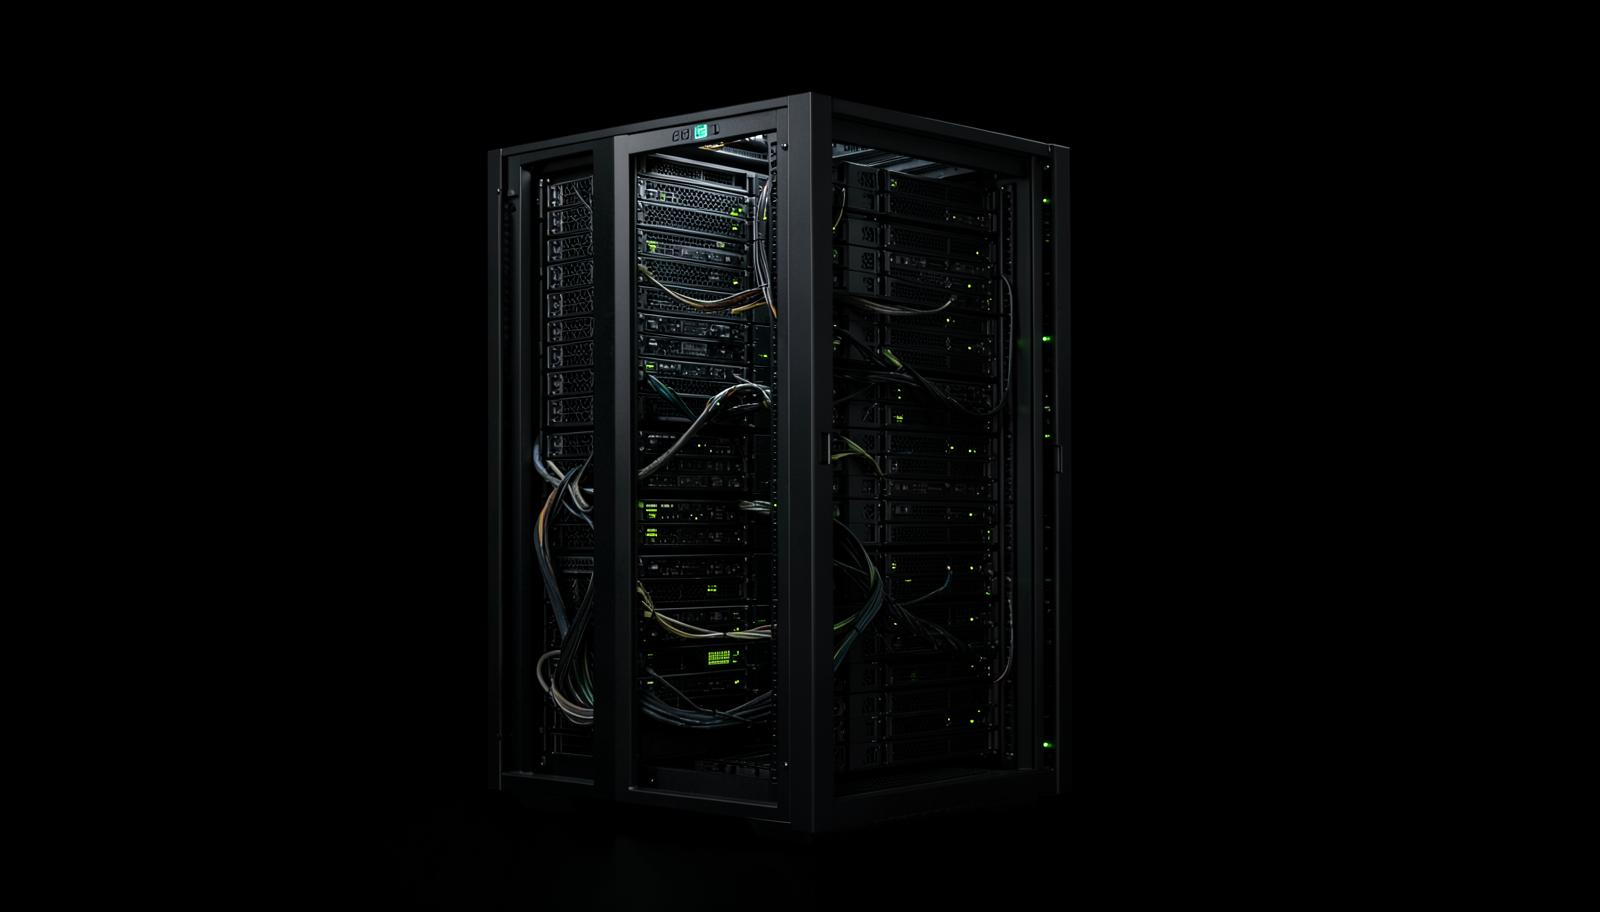
The rack is the NVIDIA GB300 NVL72: 72 Blackwell Ultra accelerators and 36 Grace host processors, per NVIDIA's published configuration. It draws 140 kW nominal at the rack input, per OEM system specifications. A 9 MW requirement is 64 whole racks and 4,608 accelerators, drawing just under 9 MW. The 8 MW envelope, IT load at the rack input, holds 57 racks and 4,104 accelerators today. The requirement is short by 7 racks and 504 accelerators. It needs about 11% off at the rack input: your arithmetic, with no number of ours in it.

The multiplication

Our coefficient is measured at the accelerator die. Your constraint sits at the rack input. Between them is the share of rack draw the accelerators account for, and that share is yours to state. Skip that step and a model overstates the reduction. On this rack the accelerator dies are about 101 kW of a 140 kW rack, which is 72%.

Both readings of the measurement travel together on every figure. The conservative reading applies 21% to the accelerator share only: 21% of 72% is about 15% at the rack input, modelled. The stated basis treats the die figure as a floor on wall watts, because a watt not drawn at the die is not converted and not cooled. That gives 21% at the rack input, modelled.

What fits, modelled

On the conservative reading, the 64 racks sit inside 8 MW with about 395 kW of headroom. The envelope now holds 67 racks and 4,824 accelerators. That is 3 racks and 216 accelerators beyond the requirement. The margin over the 11% needed is about 4 percentage points, roughly fifteen times our measurement uncertainty at the rack. Plan against this reading.

On the stated basis the envelope holds 72 racks and 5,184 accelerators: 8 racks and 576 accelerators beyond the requirement. Headroom is about 922 kW and the margin about 10 percentage points. The deal fits under either reading; the difference is what is left over. Per rack the reduction returns about 21 kW to about 29 kW. The site's rack count rises about 18% to 26%, modelled.

What the freed capacity is worth

The freed capacity is spent once. Expand the same client's deployment by 216 to 576 accelerators, let the racks to a second tenant, hold them as headroom, or bank the energy. The first two use the same racks, so count one. Take an illustrative GBP 3 an accelerator-hour at 85% utilisation, both your own figures. The spare accelerators then gross about GBP 4,800,000 a year on the conservative reading and about GBP 13,000,000 on the stated basis, modelled.

The racks that earn it are hardware you buy: about GBP 2,600,000 delivered per rack, or GBP 7,800,000 to GBP 20,800,000 of capital. The runtime is software with no capital cost; what it removes is the power constraint. The energy line is the smallest pool and needs your own measured mean draw. At an illustrative 95 kW per rack and 20 pence a kilowatt-hour it is about GBP 1,600,000 to GBP 2,200,000 a year, modelled. Those are the same watts as the headroom, so bank one use, not both.

Where the answer moves

Requirement size moves it first. On the same 8 MW envelope the boundary sits between 67 and 68 racks. At 67 the conservative margin is under half a percentage point, too thin to plan a tenancy against. A validation on your own fleet comes before any commitment there. From 68 racks only the stated basis closes the gap. From 73 racks neither does, and the answer is a larger envelope or fewer racks.

The plane of the envelope moves the answer most. If your 8 MW is total facility power, divide it by your power usage effectiveness first: the stated basis still fits at 1.10, the conservative reading needs a ratio below about 1.05, and at 1.15 neither fits, so confirm the plane before anything else. Rack draw basis comes next. At the 155 kW peak figure only the stated basis fits, and at the 192 kW busway figure neither reading does. A sustained reduction relieves a contractual demand figure, not a plant rating, so read your envelope off the contract or the switchgear schedule first.

What runs on the site

ADAPT installs as a Kubernetes and Helm runtime above the NVML interface, driver-adjacent, one lightweight service per accelerator. It needs no application code change and adds no draw of its own. It runs under existing MIG and vGPU tenant isolation and never touches placement or scheduling. It reports through standard Prometheus and DCGM metrics. Every clock decision passes a layered safety governor and commits only on a successful NVML write. Control releases the clock if latency or throughput slips.

The mechanism is duty-cycle intelligence on bursty fleets, mostly idle-floor reduction, so a fleet at full load all year returns less. Seven days of read-only 1 Hz telemetry shows where yours sits before any trial. This scenario runs the Balanced preset, the mode the coefficient was measured in. The run held throughput, 0% change, and gave up to +22% tokens per watt, both derived: the same tokens for less energy.

The standing condition

If a deployment occupies a site by virtue of this reduction, removing the software puts the site back over its limit. Continued operation is then a standing condition of the configuration. The runtime fails open to full performance on a component fault. Here that returns the deployment to just under 9 MW against 8 MW, about 960 kW over. The mitigation lives at the site: headroom held back rather than let, a curtailment right, an interlock, or a commitment set below the modelled figure. The conservative headroom of about 395 kW covers about 41% of the overdraw. Settle it in the first conversation.

What would change it

What moves the result, and how to check it on your own fleet.

The plane of your envelope moves this result more than anything about our coefficient. The model treats 8 MW as IT load at the rack input. Check it on your own fleet in three steps. Read the envelope off the contract or the switchgear schedule, and note its plane and whether it is a demand figure or a plant rating. Take the rack draw from the OEM nominal figure, not the busway provisioning figure. Then compute your accelerator share from the rack's own bill of materials, because 21% of that share is the conservative number. A three-week validation on your own racks replaces all three assumptions with measurements.

Your own numbers

The same arithmetic, on your site.

Bring your envelope and the plane it is stated on, your rack type and count, and the date the placement has to land. We will run this arithmetic on your numbers and scope a three-week validation on your own fleet.